THE PRICE TO WIN ESTIMATES PROCESS
Guest blog by Alex King, Amplio Services
There is no serious alternative to 'Price to Win', since nobody is employed to 'Bid to Lose'. Whenever a bid is submitted, you assess its likelihood of winning. This may be a quick and unstructured assessment, but it inevitably happens. Price to Win is a structured process that is measurable and repeatable. The alternative to doing a Price to Win is guessing. We assert that doing Price to Win as a structured process will achieve better results than guessing.
'Price to Win' is defined as "the highest price at which your organisation can bid and win, for a given probability of winning (PWin)". This is a provable concept. Unlike people who speak in meaningless terms like 'best case' and 'worst case' scenarios, if you bid at a 60% PWin, we expect you to win 6 out of 10 times and lose 4 out of 10 times. Price to Win is a completely external view of pricing. Despite its complexity, there are only three inputs into a Price to Win:
- Your predicted technical/quality score (as a three-point estimate)
- Your competitors’ predicted technical/quality score(s) (as a three-point estimate)
- Your competitors' predicted prices (as a three-point estimate)
The combination of the price (as a score) and the technical score is called the Most Economically Advantageous Tender (MEAT) score in Europe or 'Value for Money' in the U.S. Usually, the lowest price will get the top score for price, but there are many alternative ways of scoring price. The competitors' highest combined technical and price score will become the benchmark score to beat. Deducting our predicted technical score will give the required price as a score, which is then reversed back to a currency value.
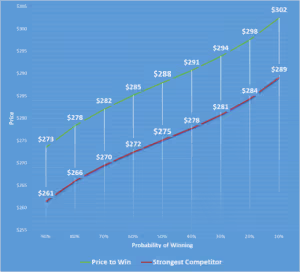
Figure 1: Example Price to Win Analysis[/caption]In this analysis, there is a 50% probability that our organisation will win if we bid at $288M. If we bid at $282M, then the probability of winning improves to 70%. This graph can be produced on any bid; if we took ten past bids where we had bid at the 70% PWin, then we would expect to win 7 of them and to have lost 3. That assures us that our process works and our analysis is accurate. It's important to remember that our profitability is not the same at $288M as it is at $282M; specifically it is better at $288M. Meaning that the 90% PWin is not inherently a good point to bid. The organisational value of Price to Win as a process is to balance the risk of losing the bid, with the rewards from winning.
Once these principles are agreed upon, there is a follow up question that we are usually asked, "where do you get the data from to do this?"
THREE-POINT ESTIMATING
Usually, the technical quality is scored on an absolute basis. That means the customer will usually define that a technical solution which does x will score 6/10. A technical solution which does x and has proven it in the field will score 8/10, and so on. In that sense, it is easier to be objective and accurate about what different technical solutions will score. Price is harder, although we do know that companies are in business to make a profit. Actual instances of companies bidding below cost are rare, although people like to speculate that they are frequent. One key concept to make better estimates of prices is to use multiple estimating methods for the same work package.
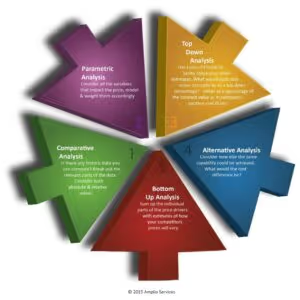
Figure 2: 5 Difference Estimating Methods
Any individual estimate can contain mistakes. By producing and reconciling these independent estimating methods, we gain increasing confidence in our Price to Win after understanding any variances. For example, we might know from historical data that bottom-up estimates are 70% accurate. That means there is a 30% chance the bottom-up estimate is wrong. But if we also have a parametric estimate, also commonly known as a predictive estimate in the States, showing a similar prediction, and we know parametric estimates are 85% accurate, the combined accuracy is now 95.5%. Add a comparative estimate with 60% accuracy that supports our answer, and our combined accuracy is now 98.2%. It's not that one estimating method is always superior to others. They have different strengths and weaknesses depending on what is being estimated. For example, parametric and comparative estimates perform exceptionally well when estimating hardware products. This is partly because hardware correlates well to certain physical design limits that are very slow to change.
In contrast, a workforce service might be better estimated with a bottom-up, and top-down analysis as the ways of offering services can change rapidly. In theory, each estimating method should give a similar answer. If the bottom-up estimate comes out radically different to a comparative estimate or a parametric estimate, the most likely reason is that there is an error in the calculations.
MULTIPLE ESTIMATING METHODS
Examples of 'Comparative' and 'Top Down' would be checking for published past prices of similar products or services; the U.S. Department of Defense is an excellent source for military prices. Likewise, top-down metrics such as 'Price per Kg' or 'Price per I.T. systems user' are usually derived from these types of data sets. These data sources are relatively straightforward in that they either exist or don't, so you either find them or you don't and that determines whether you can or cannot work with them.
'Bottom up' estimating and analysing the cost of comparable 'Alternatives' really depends on the level of subject matter experts available, which usually means the system, product or service you are estimating needs to be pre-existing to estimate with confidence.
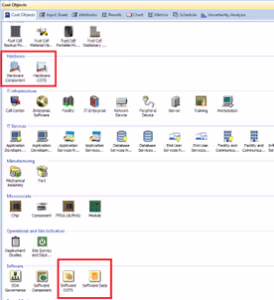
Figure 3: TruePlanning Cost Objects
]But let's say you want to estimate something completely novel. Not necessarily a new technology, but this could be a new configuration of something. Examples would include an I.T. system and service; even though all its components exist, the cost of building and operating it in that specification is novel. Services carry these variables too. If a customer wants a set of equipment at 5 locations to be maintained, then the cost of doing the same service at 50 sites will not simply be 5 x 10. Then you might occasionally be called upon to estimate something original such as a new Helicopter or a sub-system (e.g. Radar on a Helicopter). These examples are where parametric estimates work better than the other estimating methods. The main reason is because parametrics work on abstract logic, therefore, are not routed to pre-existing concepts.
To unpack this further, it's worth explaining how parametric models work. Essentially it is a multiple regression analysis from a historical dataset of ~16,000 historical projects, which have been analysed based on their common characteristics. A regression analysis is not like a lookup system. In other words, if we want to estimate a radar that goes on a Helicopter, then we don't ask the dataset to show us prices of radars. That would be 'comparative' estimating. Instead, we start to describe the technical parameters of the radar abstractly. For example, we tell the model that this is primarily a hardware product that must operate at high altitudes. The model starts to understand the cost drivers along these principles. Parametric models understand the cost drivers of hardware and software are different, as an example. It will seek different inputs to calculate the results, depending on which ones the user chooses.
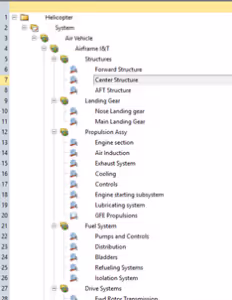
Figure 4: Example Helicopter PBS in TruePlanning
We must first enter a Product Breakdown Structure (PBS) by dragging and dropping the different aspects that the model understands (e.g. hardware, software, training etc).Having entered a PBS, each part has a standardised set of inputs calibrating the result. The standard inputs for developing a new hardware item are shown in red. So, the tool does not directly know we are estimating a Helicopter radar but instead thinks of an airborne, ruggadised mass of electronics and structure that has a given complexity to manufacture.
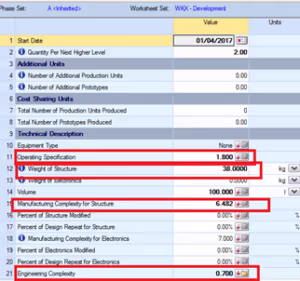
Figure 5: Inputs to a TruePlanning Hardware item
TruePlanning runs algorithms examining the relationship between the PBS inputs and its historical database to show the level of effort required to develop, produce or support the system. This is an incredibly accurate and powerful tool. Still, often it will be the only option you have to estimate novel things that simply don't have comparative and top-down estimating data available.CONCLUSIONAs complex as Price to Win is, it does boil down to 3 inputs: your technical score and your competitor's technical scores and price estimates. The latter of these is the hard part, and it's tough to run a consistent Price to Win process without parametric estimating, which is your best way to estimate novel things. If your business is highly repeatable, then you could get away without it, but it shines with systems integration effort, new products, and new configurations of I.T. services and sub-systems. Ultimately, we prove that our Price to Win process works when we are winning 6 out of 10 times that we bid at the 60% PWin and 7 out of 10 times when we bid at the 70% PWin. A big part of how we will achieve that is using multiple estimating methods for the same work packages, to compare and contrast the results. Comparative data may or may not be available, but due to its abstract nature, Parametric estimates always will be.
Learn how to improve your win rate
About our guest author:
Alex King has 11 years of Price to Win experience across multiple industries—he has grappled with the complexities of doing Price to Win from unmanned planes to call centers, from ships to signaling the London Underground and all around the world. Alex doesn’t claim to have invented ‘what’ he does, but the innovation is in the ‘how’ its done. Finding and using data, then dealing with the uncertainty are Alex's expertise.*Note: Our guest author’s views and opinions expressed in this article are those of the author and do not necessarily reflect Unison’s views.